Patent owner infographic shows contrast between Apple, Google inventor's cultures
 Mike Wuerthele
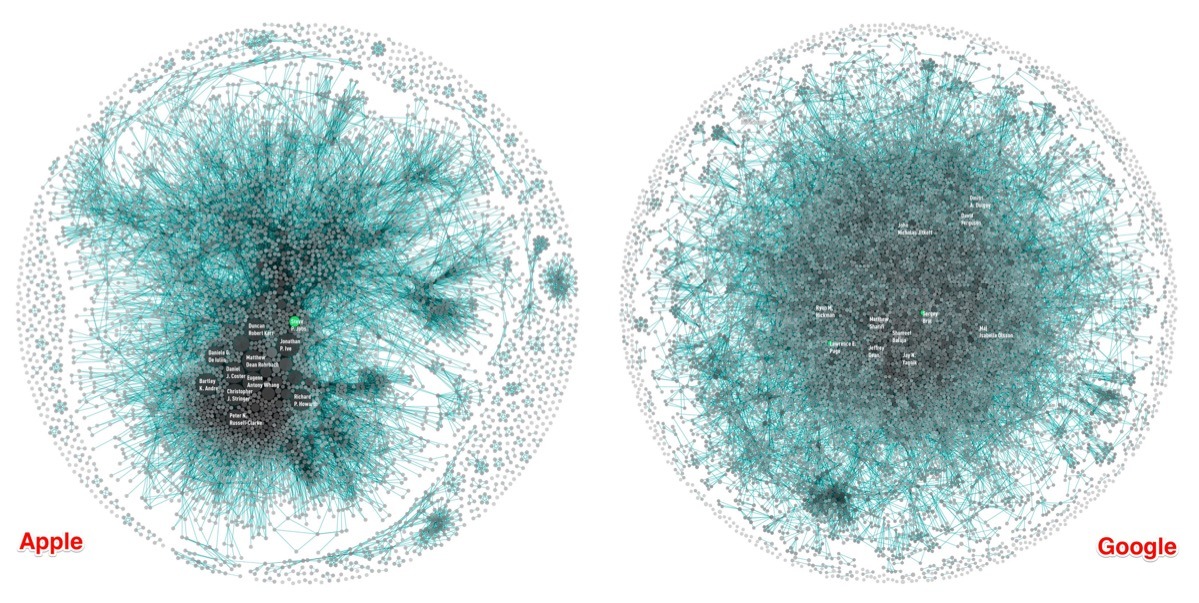
A pair of visualizations comparing Apple's and Google's "innovation signatures" shows the difference in corporate cultures between the two giants, but doesn't tell the entire tale.
A series of graphics generated by link textdata analytics firm Periscopic, commissioned by Co.Design, has charted the last decade of patent filings by the pair of companies. Every patent filer has a single dot, which grows in correspondence with how many filings they have. A line links co-inventors of any given patent.
Google's graph is more of an amorphous blob, with even founders Larry Page and Sergei Brin not well represented.

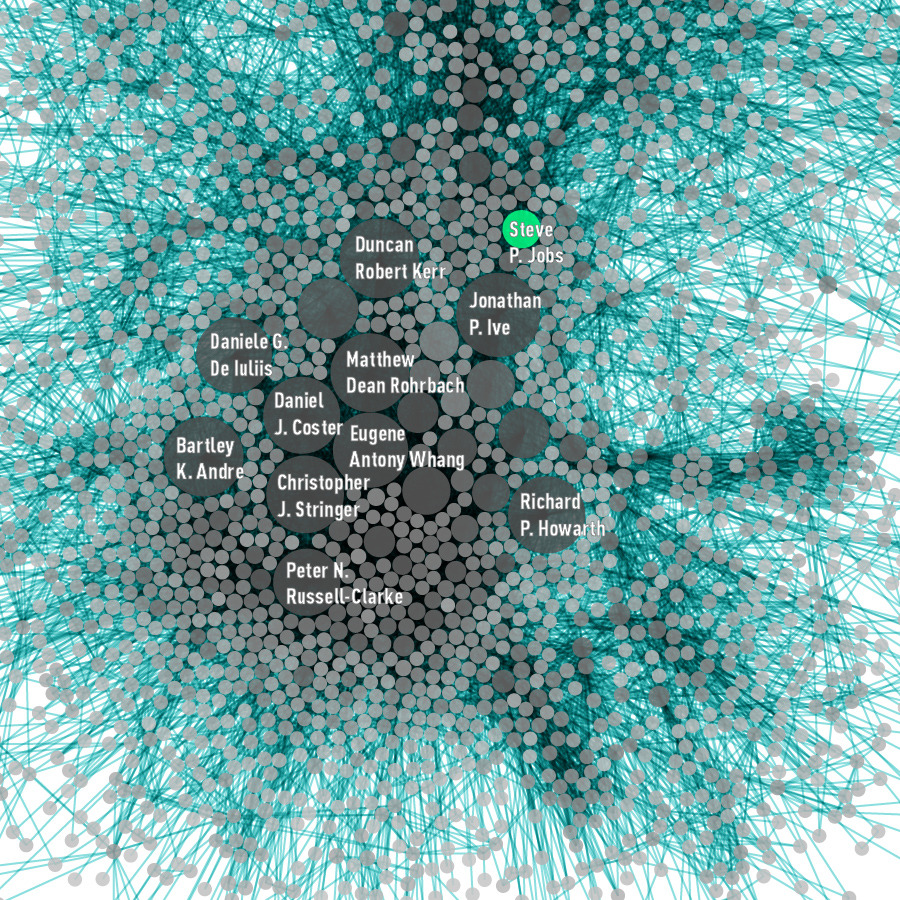
Apple's graph is leader-centric with a clear nucleus. Apple founder Steve Jobs is well-represented, as are lead designer Jony Ive and his cadre.
"Over the past 10 years Apple has produced 10,975 patents with a team of 5,232 inventors, and Google has produced 12,386 with a team of 8,888," writes data explorer at Periscopic Wes Bernegger. "This seems to indicate a top-down, more centrally controlled system in Apple vs. potentially more independence and empowerment in Google."
Both companies sport a "halo" of poorly connected patent holders. They are attributed to recent acquisitions, "skunkworks labs and shell companies," and in rare occasions, one-up inventions from acqui-hires and lone employees, according to Co.Design.
Bernegger claims that despite the outward appearance of the graphs to the casual observer, they do not fully articulate the data. Inside Apple's walls, Bernegger says that there is more "connectivity and collaboration" than at Google.
"The average number of inventors listed on a patent at Apple is 4.2. At Google, it's 2.8," says Bernegger. "These combined effects mean an inventor at Apple has, on average, produced more than twice the patents than one at Google. Nine vs. four."


 Malcolm Owen
 William Gallagher and Mike Wuerthele
 Christine McKee
 William Gallagher

 Marko Zivkovic