46% of smartphone buyers prefer Apple's iOS, 32% choose Google Android
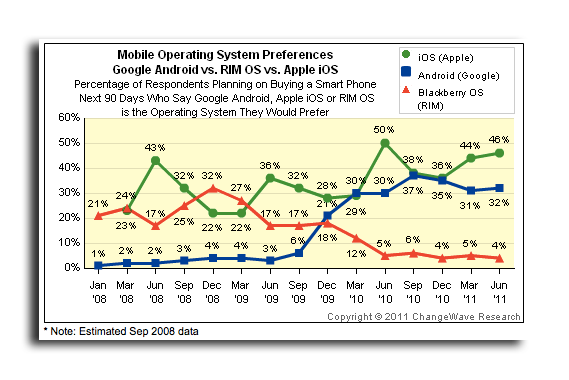
The data comes from the latest survey from ChangeWave Research via a poll it conducted of 4,163 consumers in June. The survey focused primarily on the smartphone market in North America, with 89 percent of respondents being from the U.S. and 11 percent outside of America.
The survey found that 46 percent of consumers who plan to buy a smartphone in the next 90 days prefer a device running Apple's iOS, which powers the iPhone. That's up 2 points from a poll done in March.
In second place in the latest survey was Google Android, which 32 percent of planned smartphone buyers said they will choose. Google's share also increased since March, growing by one percentage point.
The gains of Apple and Google came at the expense of rivals, as Research in Motion's BlackBerry line lost one point since March. The BlackBerry's 4 percent share is the lowest level ever seen in a ChangeWave survey, and is far away from its high of 32 percent in September of 2008.
The data showing consumer preferences for the iPhone aligns with previous polls that have told a similar story. Last November, ChangeWave reported that 34 percent of non-AT&T smartphone buyers said they wished they could buy Apple's iPhone. At the time, the iPhone was exclusive to AT&T.
The latest survey also tracked the potential impact of Apple's iCloud service, and found it will increase the value proposition of devices like the iPhone. Among current Apple product owners, 29 percent said iCloud will make them "more likely" to buy Apple products in the future, while the same was said by 13 percent of non-Apple product owners.
"This initial look at the impact of Apple's new iCloud service shows it enhancing customer loyalty," the report said. "But the survey also provides highly encouraging signs that iCloud will generate additional customer demand for other Apple products, not only from current Apple product owners but from a substantial number of non-owners as well."
The latest survey also reaffirmed that the iPhone carries the highest satisfaction rate in the industry. When asked about the operating system on their mobile device, 70 percent of users said they are "very satisfied" with iOS, while 50 percent said the same of Google. Just 26 percent said they were satisfied with RIM's BlackBerry OS.
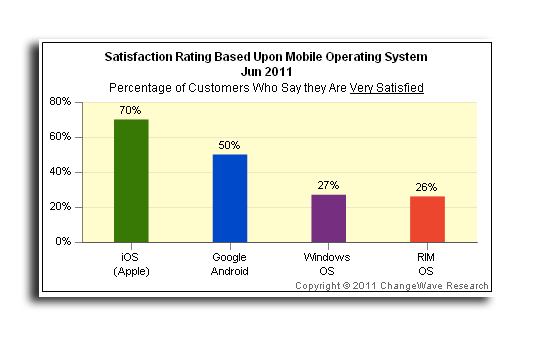
In what was characterized as an "encouraging sign" for Apple's rival Microsoft, the survey found that 57 percent of respondents running Windows Phone 7 said they are "very satisfied." That total is significantly better than the paltry 14 percent rating the previous-generation Windows Mobile OS earned.
"Even so, the higher Windows Phone 7 rating has yet to produce a sustained momentum boost for Microsoft in terms of buyer preferences," the report said.
69 Comments
These numbers are great, but unconvincing. The problem is that Apple has not had sales figures that match up against these intentions from what we've seen from Nielsen. Look at the 50% for June-10. If you actually look at Nielsen's sales numbers for the 90 days after June-10, Apple never even got close to 50% of the smartphone market - in fact they never even passed Android for those 3 months.
Unfortunately I'd have to conclude that this survey has either a significant sample bias, or some sort of methodological problem with its questions.
But the only data point you pick happens to be the one that does not follow the trend! That is the one that is obviously biased. All the other points seem to follow a credible trend.
These numbers are great, but unconvincing. The problem is that Apple has not had sales figures that match up against these intentions from what we've seen from Nielsen. Look at the 50% for June-10. If you actually look at Nielsen's sales numbers for the 90 days after June-10, Apple never even got close to 50% of the smartphone market - in fact they never even passed Android for those 3 months.
Unfortunately I'd have to conclude that this survey has either a significant sample bias, or some sort of methodological problem with its questions.
The methodology is certainly questionable. For example, what's up with the 11% non-Americans? Either you sample only US or only Europe or only Asia, or you make an effort to sample a representative mix. To me, 89+11 is a nonsensical, misleading mixture.
When it comes to future buying trends, consumer polls are often off. This surprises me because election polls are often very good indicators of the outcome.
These numbers are great, but unconvincing. The problem is that Apple has not had sales figures that match up against these intentions from what we've seen from Nielsen. Look at the 50% for June-10. If you actually look at Nielsen's sales numbers for the 90 days after June-10, Apple never even got close to 50% of the smartphone market - in fact they never even passed Android for those 3 months.
Unfortunately I'd have to conclude that this survey has either a significant sample bias, or some sort of methodological problem with its questions.
This survey is all about OS preference which may not be at all related to what people actually buy... 46% may well prefer iOS but then go on to buy Android or some other phone due to a factor beyond the OS - my guess would be price is a key here...
If I had to express a preference between a Ferrari or a Ford I'd choose Ferrari.... doesn't mean I'm ever likely to buy one...
But the only data point you pick happens to be the one that does not follow the trend! That is the one that is obviously biased. All the other points seem to follow a credible trend.
What other points follow a credible trend? The only meaningful trend that I can see is what people are actually buying. On that, the surveys have been consistently off. But maybe I missed something you spotted?