Apple to enter a new golden age in 2010 with 70% earnings growth

While Apple is now larger than Microsoft (MSFT), Google (GOOG), Cisco (CSCO), Hewlett Packard (HPQ) and Intel (INTC), Apple still enjoys the growth rate of small cap tech stocks. A few weeks ago I wrote a detailed article entitled Apple’s $63.5 Billion Revenue Year where I offer comprehensive revenue estimates for Apple’s fiscal Q3 and Q4 of 2010 – a must read for any Apple investor.
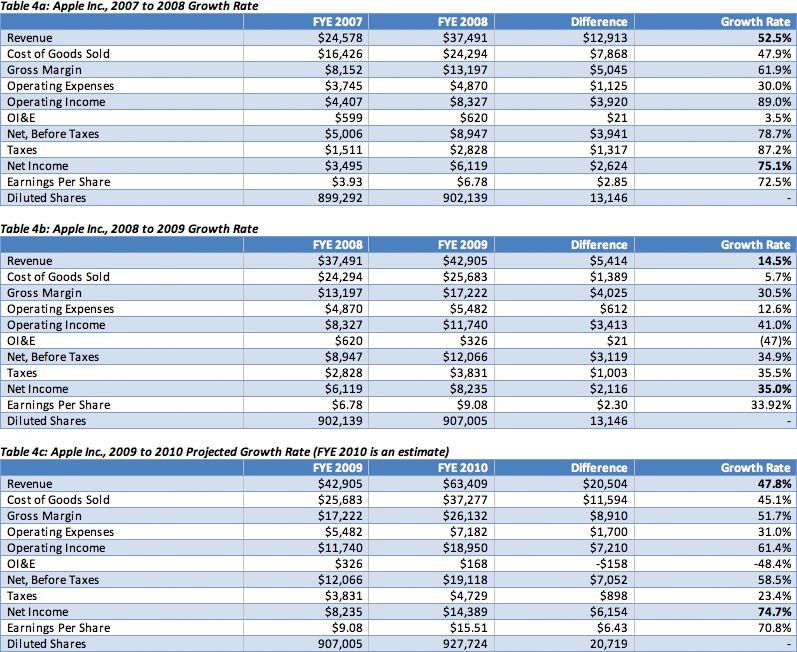
This article will pick up where that report left off, and take a look at Apple’s potential 2010 earnings. To get an idea of how deeply Apple continues to penetrate the market, last year the company produced 50% less in sales and over 71% less in earnings than it will this year. That means the 2010 Apple is nearly 50% larger than the Apple of 2009 – almost an entirely different company. If this growth continues into 2011, Apple will surpass Exxon (XOM) to become the largest corporation in America. Not to mention that it already has more cash than any other company in the United States - $41 billion.
That is absolutely stunning when one considers that Apple recorded a whopping $43 billion in revenue during the 2009 reporting period – almost double the $24 billion it recorded in 2007. While the market continues to generally slobber over the financial prospects of the iPhone and Apple’s business, I think it’s important to step back and examine exactly where Apple’s business stands. We often hear about the strength of Apple’s stock in very general terms. Yet, we rarely get a broad picture of Apple’s past, present and future growth rates.
Not only is Apple accelerating its revenue, it’s pushing more of that revenue to the bottom line. But while its sales are accelerating, the growth in the cost to run the entire Apple operation is barely climbing. This means Apple is becoming increasingly efficient at printing money as it makes more revenue per dollar spent to run the operation. This is something that every company, big or small, could only wish to achieve. It is very difficult to accelerate sales as a large cap tech stock while tempering costs.
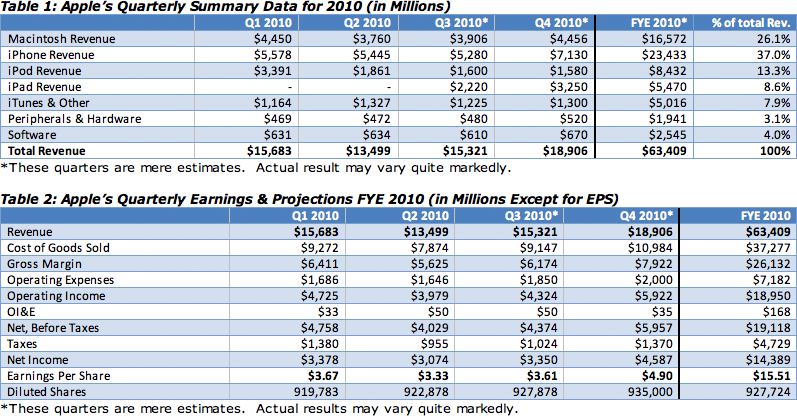
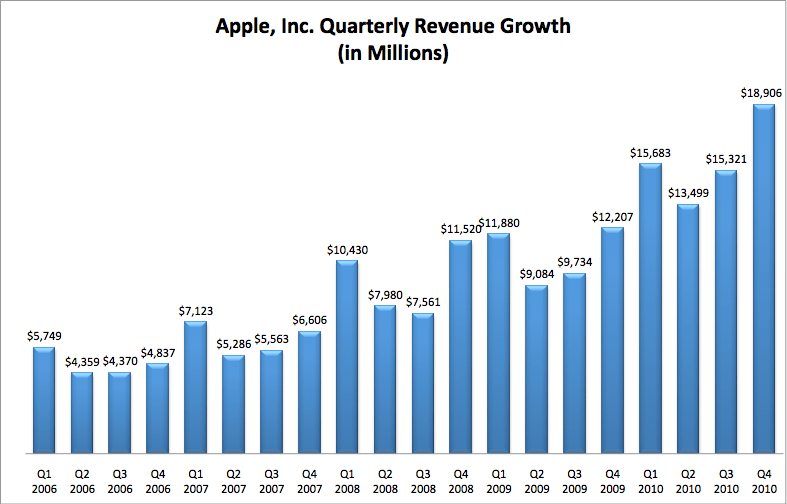
Based on the analysis presented below, I’m expecting Apple to report $15.51 in earnings per share (EPS) on an explosive $63.409 billion in revenue in 2010. That compares to $9.08 in EPS on $42.9 billion in revenue in the fiscal year ended 2009. The two tables below outline my revenue and earnings estimates for Apple’s 2010 fiscal year. For those who would like to see my track record on Apple, you can find that record at Philip Elmer-DeWitt’s quarterly analyst review published in his Fortune column ‘Apple 2.0.’
Again, this report will focus on Apple’s income statement based on the revenue estimates I’ve already published. For those who are interested on how I arrive at these revenue estimates, please refer to that article. I will also be publishing a detailed analysis of my Q3 2010 estimates in an earnings preview ahead of Apple’s numbers due out after the bell on Tuesday, July 20, 2010. Thus, to get a full picture of Apple’s 2010 fiscal year, I will present a detailed analysis of how, based on a projected revenue estimate of $18.9 billion for Q4, that a forecast of $4.90 in EPS logically follows.
Gross Margin Estimates: 41.9%
Anyone can draw relatively reliable quarterly estimates for Apple simply by analyzing the seasonal trends of consumer spending of Apple products. Once one arrives at rigorously thought out revenue estimates, he or she must then perform an analysis of each line item of Apple’s income statement starting with gross margin.
Gross margin is the amount of money Apple makes on each of its products less the cost it takes to make those products. The only costs considered are the manufacturing cost, the bill of materials, and the packaging cost. These costs are called the cost of goods sold or ‘COGS.’ Subtracting the total cost of goods sold from Apple’s overall revenue will give you Apple’s gross margin.
Determining what Apple’s total gross margin will be in any one of Apple’s fiscal quarters requires an understanding of which of Apple’s product tend to carry higher gross margins, a careful analysis of Apple’s guidance for gross margin, the seasonal trend, the strength of the U.S. Dollar relative to the Euro, and whether a newly introduced product carries a higher or lower gross margin relative to the company’s average.
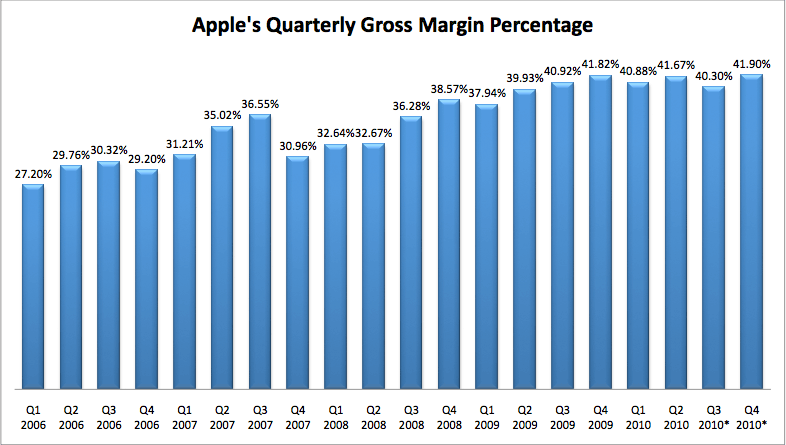
For example, in Q2 Apple reported 41.67% in overall gross margin percentage. The relevant information required to forecast gross margin for Q3 is: (1) Apple’s comments where it guides down gross margin to 36% owing to supposed lower margins on the iPad; (2) the seasonal trend which suggests that Q3 is stronger than Q2 for the past 4 years; (3) the amount by which Apple generally beats its own forecast (its sizable), (4) the number of iPhones Apple sells as the iPhone possesses the highest gross margin of Apple’s products, (5) the collapse of the Euro which suggests that Apple will see some pressure on ASPs this quarter (though Apple has admitted to be hedged for this potential event) and (6) the lower ASP on the iPod and Macintosh this quarter.
Based on an analysis of these issues (which I will publish in my earnings preview), I arrive at a 40.3% gross margin estimate for Q3. For while Q3 generally outperforms Q2, the weakness in the dollar, and the introduction of the iPad will undoubtedly put margin pressure on Apple this quarter.
Yet, when looking at Q4 gross margin estimates, one must consider the fact that Apple will likely sell well over 11 million iPhones due to the introduction of the iPhone 4. Knowing the iPhone to enjoy higher gross margins than Apple’s other products, one should conclude that overall gross margins will strongly benefit from huge iPhone sales in Q4.
Moreover, since the introduction of the iPhone, Apple’s best quarter for gross margins has been Q4. In Q4 2008, gross margin jumped from 36.28% in Q3 to 38.57% in Q4. In 2009, Apple saw a 1% increase from 40.92% to 41.82%. As Apple is set to record explosive iPhone 4 sales in Q4, I’m expecting gross margin to rise to 41.9% from the projected 40.3% I’m expecting in Q3. The chart below outlines Apple’s gross margin percentage from 2006 to 2010, which include my estimates for Q3 and Q4 2010.
Operating Expenses: $2 Billion
Based on the gross margin percentage estimate of 41.9%, I’m looking for Apple to post $7.922 billion in overall gross margin. To arrive at operating income, one must project operating expenses. Operating expenses are all the expenses related to running the Apple operation. The geniuses at the Apple store, Steve Jobs’ $1 income, the rental cost of all of Apple’s retail stores, the employees, the paperwork, the Apple campus in Cupertino and all other money spent to run the company are all what is included in operating expenses. Based on the current trend in Apple’s guidance, one can produce almost exact estimates for operating expenses.
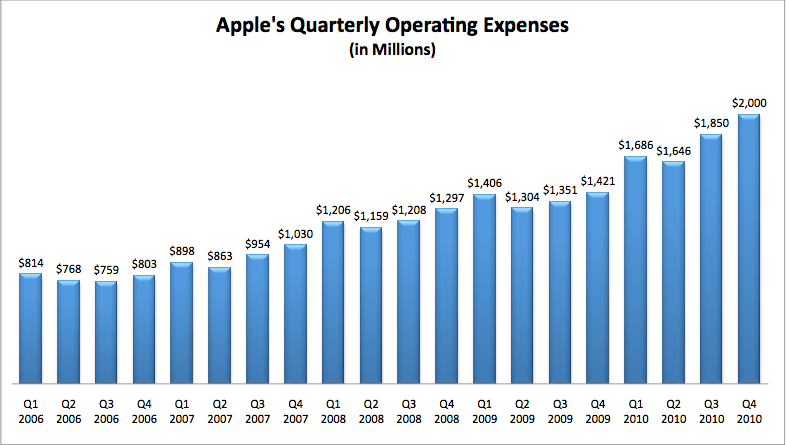
There are several quarters where I was able to forecast these expenses almost perfectly because Apple would regularly guide $40 million under the actual results. Picking up on this trend, it has been relatively easy to predict these expenses. Yet, one must also consider the growth trend of these expenses to help facilitate a strong forecast.
For Q3, I arrived at an estimate of $1.850 billion in operating expenses based on Apple’s guidance, and based on the trend. Knowing that Q4 tends to be one of the highest quarters in terms of operating expenses due to Apple mass hiring to meet consumer demand of the iPhone and back to school shopping season, I’m expecting a $150 million bump to $2 billion in Q4. The chart below outlines Apple’s operating expenses from 2006 to 2010. Q3 and Q4 are merely estimates and actual results may vary.
Operating Income, OI&E and Income before Taxes
To arrive at operating income, income that Apple generates from its primary operations, one must simply subtract operating expenses from gross margin. Remember operating expenses are those expenses that only include the costs to run the entire Apple operation. Gross margin, on the other hand, is the amount of money Apple makes on the sale of each of its goods (revenue) minus the cost it takes to bring those goods into existence i.e. to make those goods. Thus, for Q4 I’m forecasting an operating income of $5.922 billion, which is the difference of subtracting $2 billion in operating expenses from the projected gross margin of $7.922 billion.
Yet, companies will regularly make and/or lose money on the sale of property, from interest on their cash deposits, or from investments. Good accounting requires that we keep that income or loss in a separate category because it would be inappropriate to suggest that income from an investment should be part of the income that Apple receives from the sale of its goods.
So under generally accepted accounting principles (GAAP) we have a line item in the income statement called “Other Income & Expenses†or OI&E. Though the dollar amount of OI&E is generally a small amount compared to Apple’s operating income, it can and will regularly affect EPS and so it should be taken seriously. Based on Apple’s guidance, which generally undercuts or overstates OI&E by $5 million, I’m projecting OI&E to come in at about $50 million for Q3 and $35 million for Q4.
Finally, to arrive at income before a provision for income taxes, one only needs to add operating income to OI&E. In this case, I’m expecting $5.922 billion in operating income, and $35 million in OI&E for Q4. Thus, we arrive at a net income before taxes of $5.957 billion.
Provision for Income Taxes & Net Income
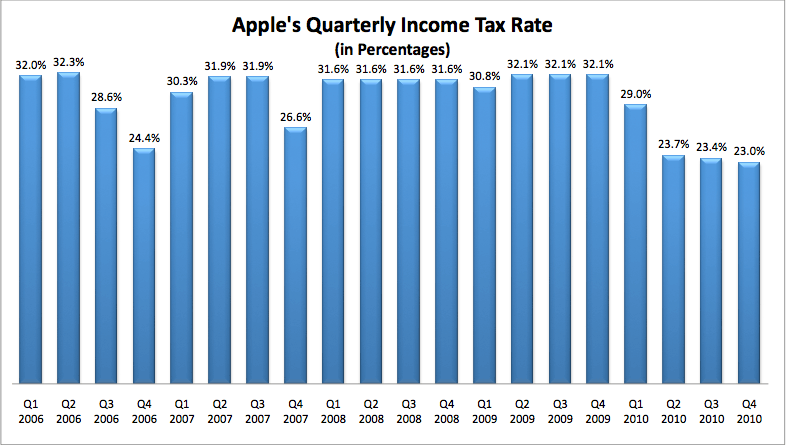
Income taxes can greatly influence the outcome in earnings per share, and thus demands careful consideration. Evidence suggests that Apple will post some very favorable tax rates for Q3 and Q4 of 2010. In Q2, Apple already posted an unusual low tax rate of 23.7%, and looks to continue that rate, based on its guidance, in Q3 and probably in Q4. Q4 is generally Apple’s most favorable tax rate quarter but only slightly better than Q3.
For Q3, I’m estimating a tax rate of 23.4% based on Apple’s comments for the quarter. I’m also expecting a very favorable rate of 23.0% in Q4. Thus, based on a tax rate of 23.0% for Q4, I’m looking for Apple to record a post tax profit of $4.587 billion in fiscal Q4. The chart below outlines Apple’s tax rate, inclusive of my Q3 and Q4 estimates, from 2006 through 2010.
Earnings Per Share
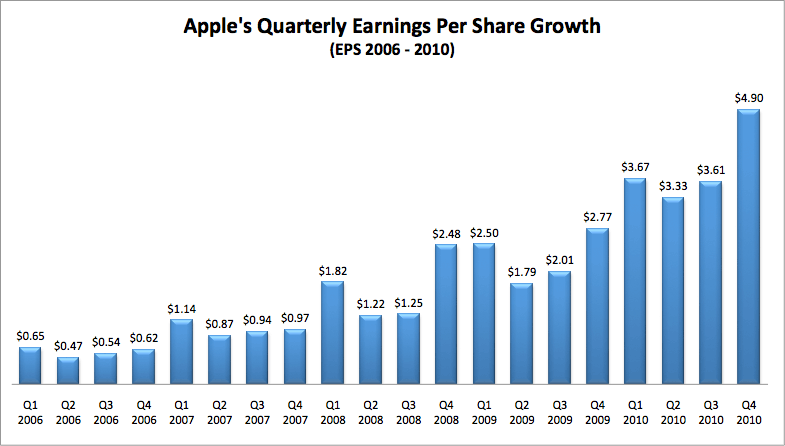
Once you arrive at net income, the job is basically done. One only needs to divide net income by the number of projected outstanding diluted shares to arrive at Earnings Per Share or EPS. Based on a projection of 935 million shares outstanding at the end of Q4 2010, my estimates are calling for Apple to report $4.90 in EPS on $18.906 billion in revenue versus the current consensus of $3.73 in EPS on a conservative $16.54 billion in revenue. The chart below outlines Apple’s EPS growth from 2006 to 2010. This chart presents undeniable evidence that Apple has entered yet another golden age of growth. Apple is truly firing on all cylinders.
Apple’s Earnings History
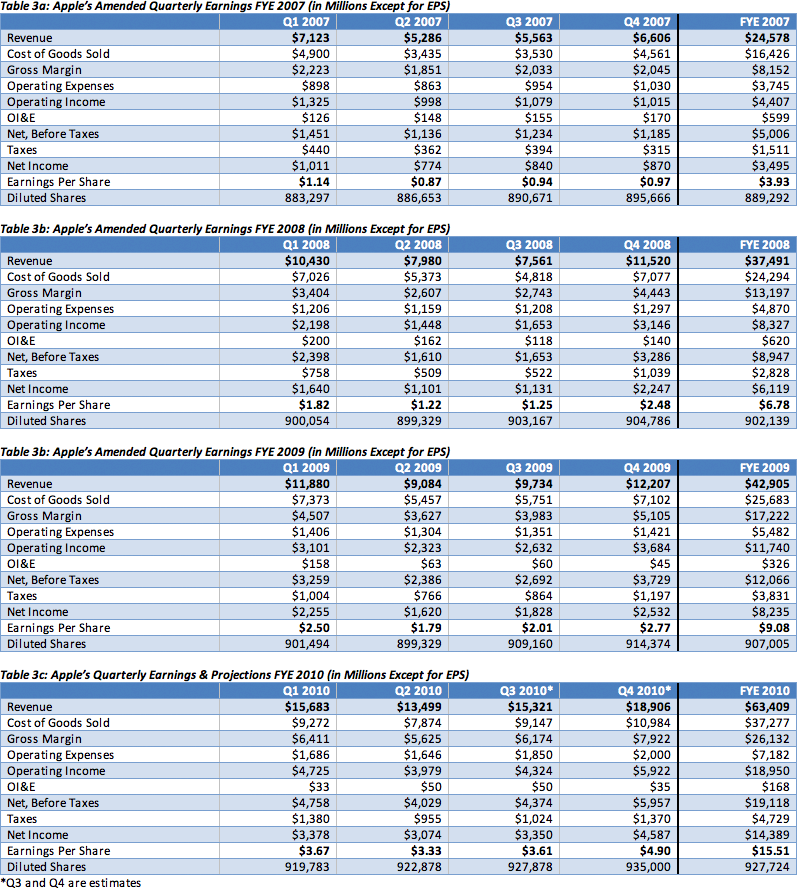
The four tables below present Apple’s revenue and earnings history from 2006 to 2010. Due diligence begs the average investor to have at least a general working knowledge of these tables. These income statements have been amended to account for Apple’s new GAAP accounting measures. These new accounting measures were implemented in Q1 2010 resulting in dramatic amendments to each of Apple’s fiscal quarters between 2007 and 2010. These income statements can also be found on Apple’s website.
Apple’s Year over Year Growth Rates
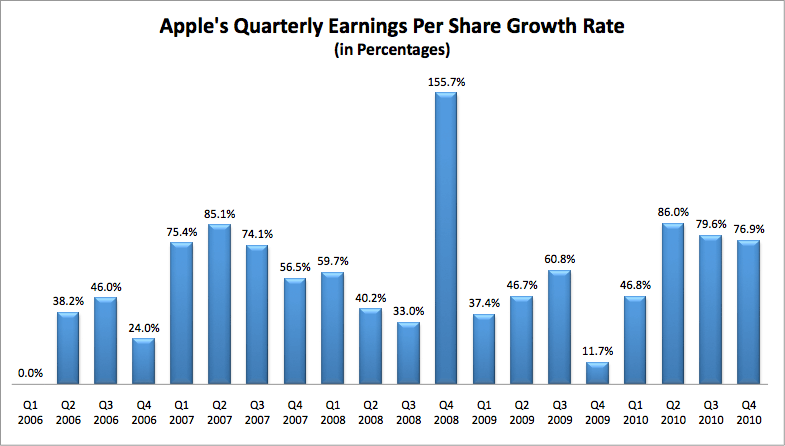
The three tables below outline Apple’s (AAPL) year-over-year growth rates for the past 3 fiscal years. The first thing that should be noticed is how Apple’s growth rate decelerated in 2009, and then reaccelerated in 2010. These tables are a very useful guide for performing fundamental analysis and establishing price targets on Apple. Also note the 75% net income growth and the 70.8% EPS growth in fiscal 2010. If this type of growth continues into 2011, then Apple will likely see $350 sometime next year.
Andy Zaky is a graduate from the UCLA School of Law, an AppleInsider contributor and the founder and author of Bullish Cross — an online publication that provides in-depth analysis of Apple's financial health.
 Andy M. Zaky, Bullish Cross, Special to AppleInsider






 Malcolm Owen
 William Gallagher and Mike Wuerthele
 Christine McKee
 William Gallagher

 Marko Zivkovic


